What is ACRIS?
The Automated City Register Information System (ACRIS) lets you look up property records for buildings in NYC for all boroughs except for Staten Island.1 ACRIS is an important and under-used dataset; it is the best source of information if you want to gain a better understanding of the current ownership and financing of a building as well as its history.
ACRIS data helps answer relatively simple questions — who is the most recent lender to the building, and how much did the current owner buy the building for? — as well as more complicated ones — is the landlord making conservative financial decisions to ensure secure housing for their tenants, or are they taking on more risk and engaging in speculative tactics in order to increase their profit? It also gives you a glimpse of how the building has been treated historically — have there been foreclosures or other signs of financial distress, or has the value of the building risen significantly over the years?
In this guide, we will discuss how to navigate the ACRIS website and how to begin interpreting the information you may find. As a start, we will walk through an example building where we will see a common financial pattern found in multifamily rental housing. This pattern contains many of the basic elements that are important to understand when piecing together the puzzle of landlord strategy and building finance. However, the records for different buildings will inevitably vary, and it can be time consuming to make sense of how all the ACRIS records fit together. Many people shy away from ACRIS for this reason. But hopefully, by the end of this guide, you will be inspired to dig into this data source as part of your research to understand the financial incentives motivating a landlord, and the lenders or investors funding them.
______________________________________________________________________
Table of Contents
-
Example Building: 2176 Tiebout Avenue – Follow along as we piece together the financial history of a building and think about how it affects living conditions.
-
How to Use ACRIS – Different ways to search on and use the ACRIS website.
-
Other Common Patterns You Might See – Common document patterns/considerations that did not show up in our example.
-
ACRIS Fields – A breakdown of the different fields available in ACRIS.
-
Types of Documents – The types of documents we find most useful on ACRIS as well as what the different fields represent for each.
______________________________________________________________________
Before diving into the example building, we must briefly speak about why understanding a building’s financing is so important. Financing can seem abstract and amorphous compared to tangible and immediate issues such as a rodent infestation or lack of heat. But, from the perspective of a landlord, mortgage payments and other expenses like repairs, maintenance, and utilities are very much connected. In the simplest case, a building’s source of income is the rent roll. Landlords then use part of this money to maintain the building, completing necessary repairs and upgrades, and keep the rest as profit.
However, in NYC, landlords almost always have a large mortgage on their properties. For one, financing is necessary in order to purchase buildings — very few would be able to (or want to) buy a building worth millions of dollars with cash alone. But more importantly, landlords often keep large mortgage balances on their buildings as part of their profit strategy (LINK). When a landlord takes out a mortgage, a new expense is added to the budget equation. Now, the landlord will divy up the rent roll to cover both building maintenance and debt service. Debt service refers to the monthly payments the landlord must make to their lender after borrowing money. The more money the landlord borrows, the higher the debt service will be. The higher the debt service, the less money there is to be spent on keeping the building well maintained.
There’s a lot more to say about how landlords conceptualize buildings as vehicles for profit. For this reason, the ACRIS Guide works best in conjunction with the Landlord Operations and Financing Guide (LINK), where landlord financing strategy is explained in more detail and put in the context of its potential impact on tenants and building operations. In the other sections of the guide, we will focus on how to collect data necessary for this broader analysis. We also mostly focus here on looking at building-level financing information. However, landlords often think in terms of their entire portfolios, and it is often wise to do the same when looking at ACRIS data for the purposes of research. For more on that, you can look at our Research a Portfolio Guide (LINK).
Okay, finally: on to the example! First we will walk through how to collect the relevant information from ACRIS. Then we will dig more into how to interpret what we find. Additional resources on how to navigate the ACRIS site, general definitions, and other common patterns you might see can be found in the example analysis in the next section.
1 The Richmond County Clerk maintains their own records. They have cited security and legal reasons, as well as financial, in their continued decision not to join DOF’s ACRIS despite multiple invitations.
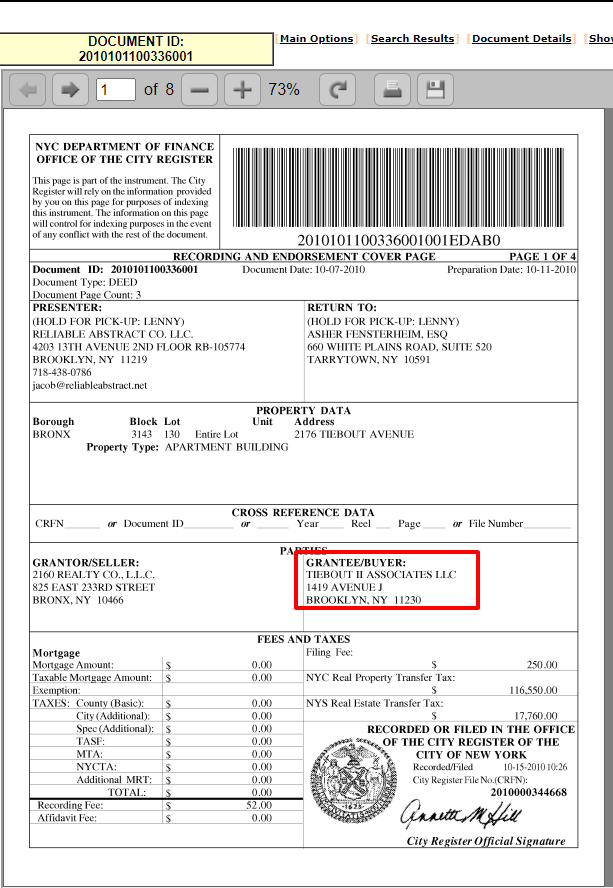
Example ACRIS Search: 2176 Tiebout Avenue
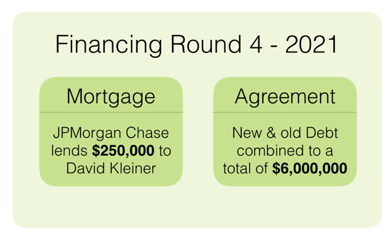
For our example we will be looking at 2176 Tiebout Avenue, a 60 unit building in the Bronx. The BBL (Borough, Block, Lot) of this building is 2031430130. The parcel identifier, or BBL, is used because in NYC ownership is tied to tax lots, not buildings. In other words, when “buying a building” landlords are actually buying the tax lot. Ownership of this real property then entitles them to ownership of any buildings on the plot of land. For this reason, ACRIS uses BBL, which identifies a specific tax lot, when recording sales and mortgages as the actual plot of land is the asset in question.
Before we jump in, here is a brief overview of some of the things that we will be able to learn about the building by looking at ACRIS. First, we will be able to determine that the owner of the property is notorious Bronx landlord David Kleiner (aka David David). He purchased the property in 2010 and since then has continued to regularly increase the debt level on the property via three rounds of refinancings. As of 2021, there are many serious violations in the building – 69 HPD violations total, 17 of which are class C or immediately hazardous. There are multiple violations relating to mice and roach infestations, issues with mold, as well as a violation relating to the front door of the building not locking. Digging into the ACRIS data and building an understanding of the refinancings Kleiner has completed with Capital One will allow us to show that while serious building conditions existed, Kleiner was able to continually claim that the value of the building was increasing and profit through the taking on of debt. As of now Kleiner has been able to recoup all of the money he spent on the building and take out an additional $1.5M as profit.
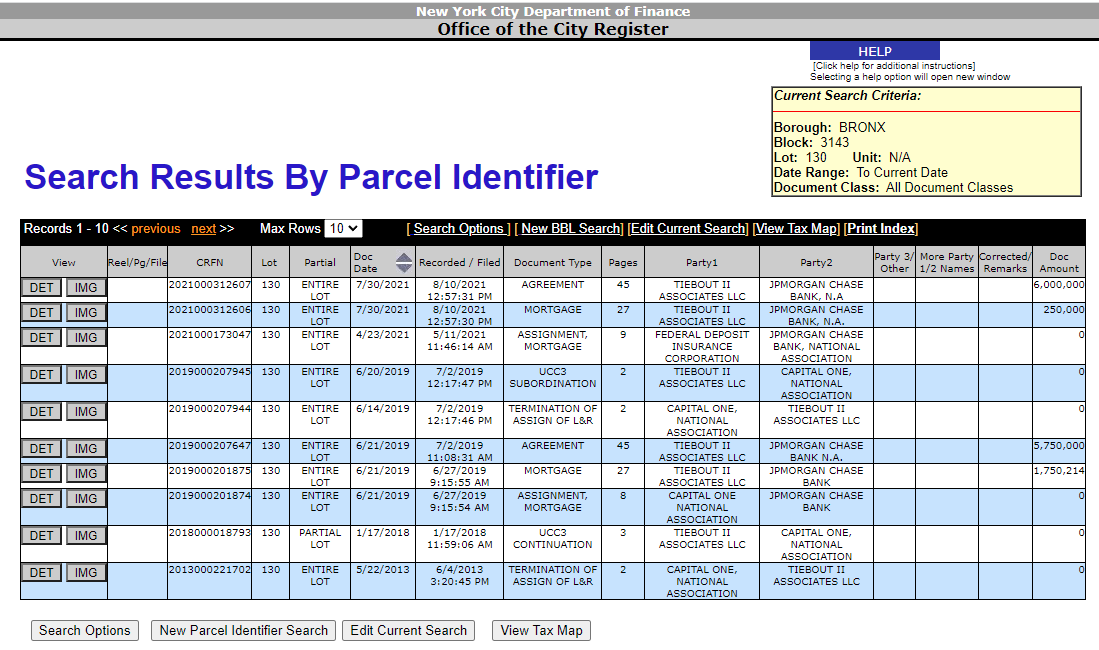
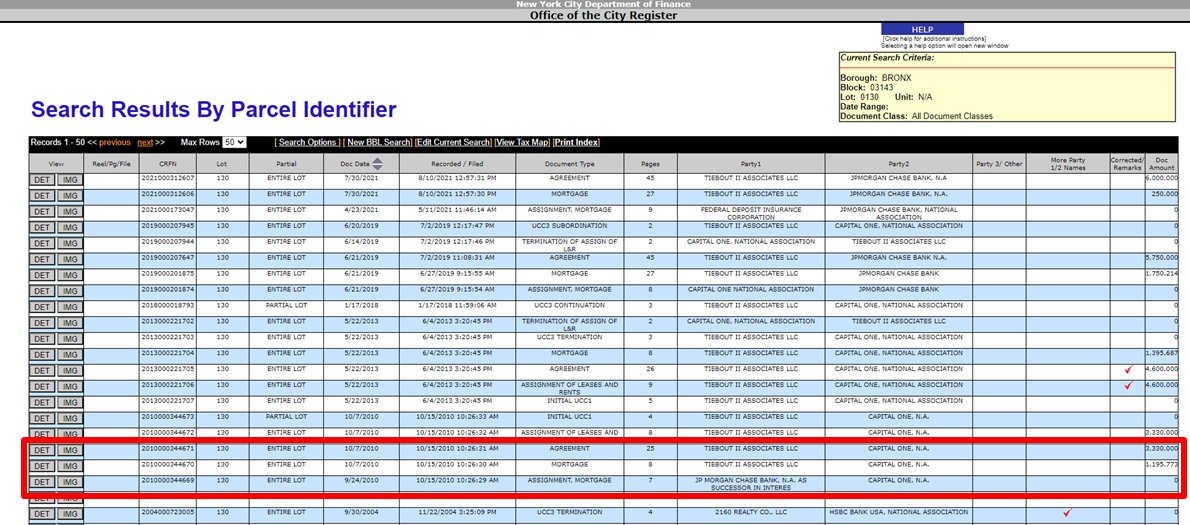
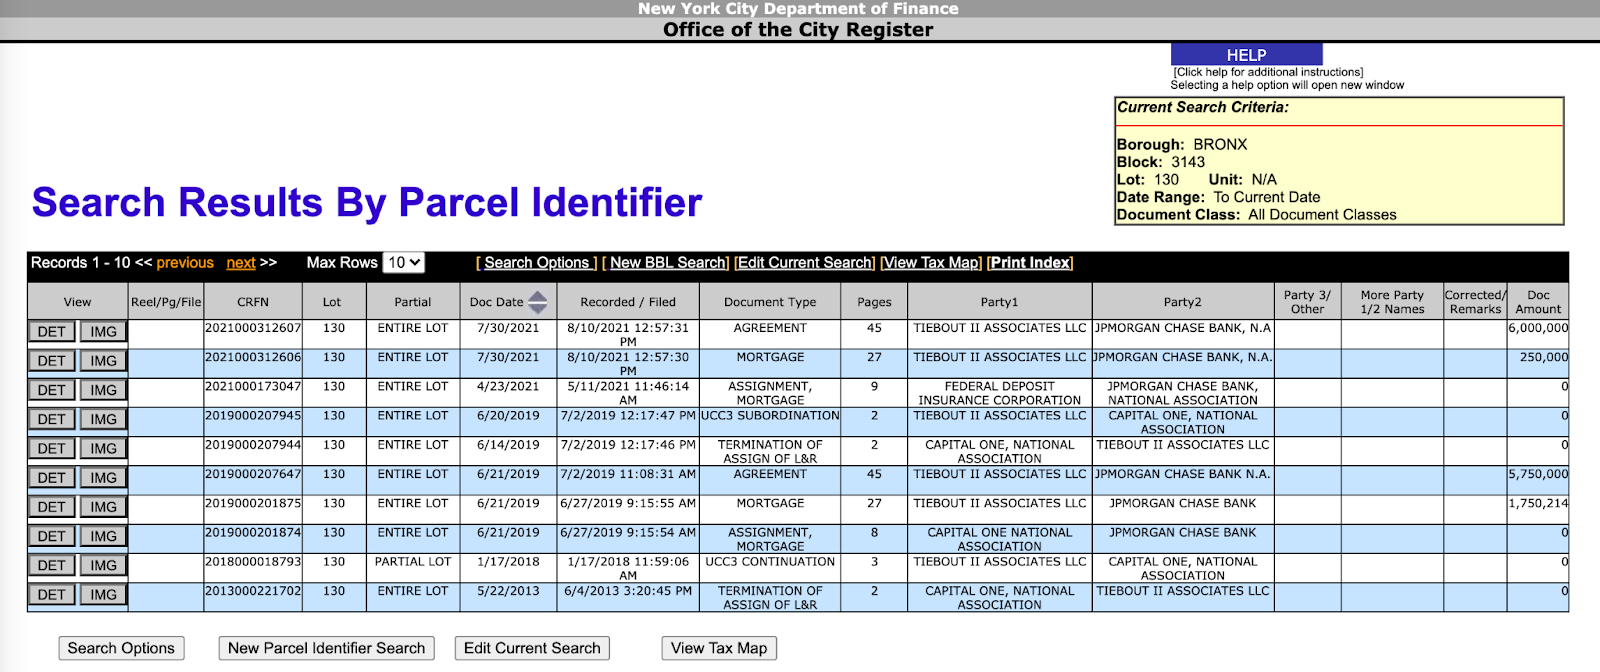
We will ‘Search Property Records’ on ACRIS using the ‘Parcel Identifier (Borough, Block, Lot)’ option. Below is a screen shot of the results from the parcel identifier search. The ten most recent documents associated with the parcel are displayed with tabulated summary information. ACRIS tracks documents relating to property ownership and financing. This means that you will be able to find deeds as well as mortgage documents. Importantly, there are multiple types of documents that are related to mortgages, which we will discuss in greater detail as we move through this example property. To see a list of the document types we think are most important, refer to the Types of Documents list in the Useful Terms section of this guide.
The column headers are in gray with each white or blue row representing a document. In this table view, you are able to see the type of document that was issued, when it was issued, the names of the parties involved, and the amount of money involved. For example, in the screenshot, the most recent document is an Agreement between Tiebout II Associates LLC and JPMorgan Chase Bank, N.A for $6M signed on 7/30/2021. To read more about what the information in each column means for the different types of documents in ACRIS, see the How to Use ACRIS section (LINK) of this guide.
While the tabulated data is helpful, and a good starting point, there is actually a lot more information in ACRIS, in the form of the actual financing and transaction documents. If you click on the gray

button in the leftmost column you can actually view a PDF of the entire document. While reading legal language and looking at financing documents can be jarring at first, we will walk through some important sections within the different document types throughout this example. Oftentimes, actually opening the documents allows you to find really useful information that you would not otherwise have access to.
First Steps
Purchase of the Property
Typically when looking at ACRIS, our first step is to look at what has occurred under the current owner. Building out a financial history under the current owner allows us to begin to identify what type of financial strategy they have chosen to employ, which is an important insight into the landlord’s views of the property as a profit generating asset. It also allows us to see what financial institutions have enabled/funded the landlord by providing debt.
The first step in establishing this financial history is to determine when the current owner bought the property and how much they paid for it. This means finding the most recent deed. Expand the amount of documents you are able to view in the table by using the ‘Max Rows’ dropdown at the top of the table. Then scan through the ‘Document Type’ column for a DEED.
Once you find one, check the ‘Doc Date’ as well as the ‘Doc Amount’. This is necessary to ensure that the deed represents a meaningful transfer of ownership. Sometimes, landlords will simply restructure the way in which they hold the title to a property. For example, they can do this by establishing a new LLC or simply transferring ownership to an LLC they already have. When this happens the ‘Doc Amount’ will be zero. However, note that if the ‘Doc Amount’ is zero and the ‘Doc Date’ is from before 2003, the deed may very well represent a meaningful transfer of ownership. This is because the ACRIS database was overhauled in that year, and ‘Doc Amount’ was not stored as a field in the data until then. To read more about how to identify what is happening with deeds you may see, read the note on deed amounts below.
____________________________________________________________________________
Deed Amounts
Deed documents can be tricky – just because there is a deed, it does not mean that there has been a full transfer of the property between entities. There are specific things to watch out for, which we discuss below in the How to Use ACRIS (LINK) section of this guide. For now, however, when trying to identify whether a deed represents an actual sale, it is most important to make sure that the deed amount in question contains a “reasonable” document amount.
You can gauge whether or not a deed amount is reasonable by comparing it on a per unit basis to other buildings sold in the same year and borough. Each building in NYC is unique, and can have many different factors that would influence its sales price — the condition of the building, size of the residential units, number of commercial units, and more. However, buildings are typically valued, and therefore sold, within a relatively small range of values when you look borough by borough in any given year. This clustering of prices is due to a variety of factors, most importantly the average rent level a landlord is able to fetch in an area.
Below is a graph showing the price per unit in the Bronx over a range of years. You can use this graph to determine whether or not the amount associated with a deed seems to reasonably reflect a full transfer of ownership. The graph shows that in 2019 the average price per unit of a Bronx multifamily building was about $170,243. We would consider a deed price relatively near to this per unit average average, say anywhere from $95,243 to $245,243, to be significant. But if you were to see a deed from a Bronx building in 2020 that translated into a $50,000 per unit price, that would raise a red flag. Are you seeing a partial sale, or is there some reason that the building would be heavily discounted?

Deed document amounts that we would not consider significant could represent a variety of situations. First, it could just simply be bad data. ACRIS, like all large datasets, is full of incorrect data often due to human error. An oddly low deed document amount could also indicate that a partial sale occurred – multiple parties can own smaller stakes in a single property. An oddly high amount could indicate a portfolio sale – when multiple buildings are bundled together and sold in a single transaction. You can read more about how to identify portfolio and partial sales in the What Else Can We Learn (LINK) section of this guide.
____________________________________________________________________________
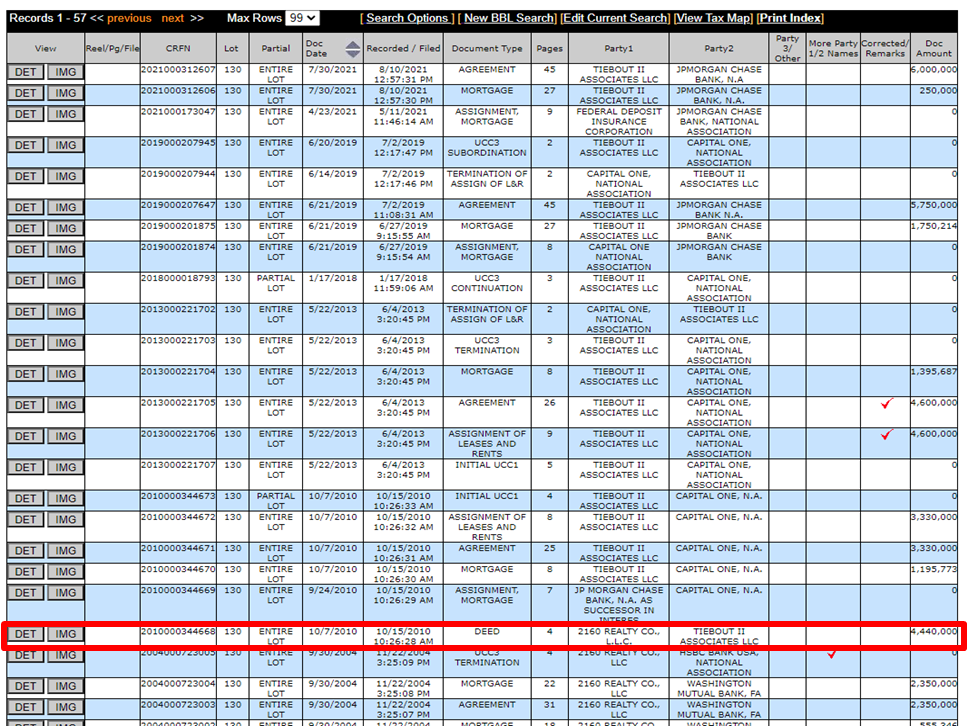
Now, let’s return to the case of 2176 Tiebout. In this case, the latest deed — outlined in red in the photo above — looks like a true sale. The average price per unit in the Bronx in 2010 was around $80,000. The sales price gives a price per unit of $74,000 which is very close to the borough average. Secondly, the names of the two parties involved differ from one another as well as the addresses that they are both associated with.
From the table we can see that Tiebout II Associates LLC bought the property from 2160 Realty CO., L.L.C. on 10/7/2010 for $4.44M. With deed documents ‘Party1’ is the seller and ‘Party2’ is the purchaser.
Unfortunately, the PDFs of deed documents typically provide very little additional information due to the structure of the forms commonly used, and the fact that landlords using an LLC to purchase a building are not required to include their name anywhere on the form. While this can be frustrating, looking for the name of the person who did sign on behalf of the LLC as well as the address associated with LLC can help as you try to determine the true identity of the owner. For more on this, see the Ownership part of the What Else Can We Learn section (LINK) of this guide.
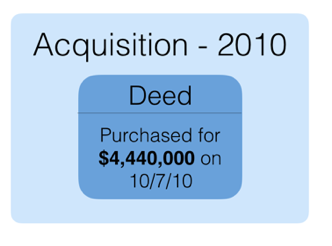
Here is a graphic showing our key takeaways from this section. We learned that the building was purchased in 2010 for $4.44M. It is somewhat unclear as to who the actual owner is, as the deed lists the LLC name. As we move through our example, we will continue to pull out these highlights so that we can reference them when we begin trying to piece together a financial history of the building under the current owner. We will also track a few key metrics: debt per unit, total debt, and how much debt has been paid off.
Types of Financing
Acquisition Financing
After finding the deed, we will look to find the acquisition financing. In other words, we will look to see what type of loan the owner took out when purchasing the building. It is almost guaranteed that the owner will have taken out a mortgage due to the high prices of multi-family buildings in the city. While some landlords in the city could technically pay for a million dollar building upfront in cash, it would not be a smart financial decision. From a profit seeking perspective, the smart choice is to take out a mortgage. This allows them to spend a fraction of what they would if they were to buy the building outright. While technically using a mortgage is more expensive in the long run — significant interest payments are added onto the principal amount (the actual dollar amount the landlord is borrowing) — landlords often do not really plan on paying them off until they sell the building, which we will explain below.
Landlords are generally able to borrow up to 75% of the building’s assessed value. This measure of the debt as a percentage of the building’s value is known as Loan to Value (LTV). LTV is commonly used to quantify the amount of risk that the lender (bank) is taking on when issuing a mortgage. If a landlord defaults on their mortgage, the bank can recoup the money owed by taking over ownership of the building and then selling it. If the amount of debt gets too close to or exceeds the value of the building, the bank will not be able to recoup the money that they lent. Generally, the maximum risk that banks are willing to take is a LTV of 75%.
The standard mortgage structure that most New York landlords employ is known as a CEMA (Consolidation, Extension, and Modification Agreement). This financial strategy allows landlords who are selling their property to pass their debt onto the new owner. The buyer can then take out additional debt and roll it and the debt from the previous owner up into one large loan. The buyer, by assuming the previous debt and adding additional debt onto it, is able to avoid paying a significant amount of mortgage recording tax.
Mortgage recording tax is charged anytime a mortgage is issued. Mortgage tax is a large upfront expense for landlords. In 2021, the rate for larger loans is 1.925%. While this might not seem like a very high percentage, when you consider how large multi-family loans are the amount due can be quite high. For example, if an owner takes out a mortgage for $1M, they will owe $19,250 in tax.
In the case of a CEMA, the buyer is able to significantly reduce the amount of mortgage tax that they owe because the tax is only applied to the additional debt that they decide to take on. They do not pay any mortgage recording tax on the debt from the previous owner that they are taking over.
In ACRIS, CEMAs show up as a combination of three documents: a mortgage, an agreement, and potentially an assignment. In the case of an acquisition, the mortgage represents any additional debt that the buyer has decided to take out. The agreement represents two things: the transfer of the previous owner’s debt to the buyer, and the rolling up of this previous debt with the additional debt the buyer has chosen to take on. The assignment represents the transfer of the loan from one financial institution to another when necessary.
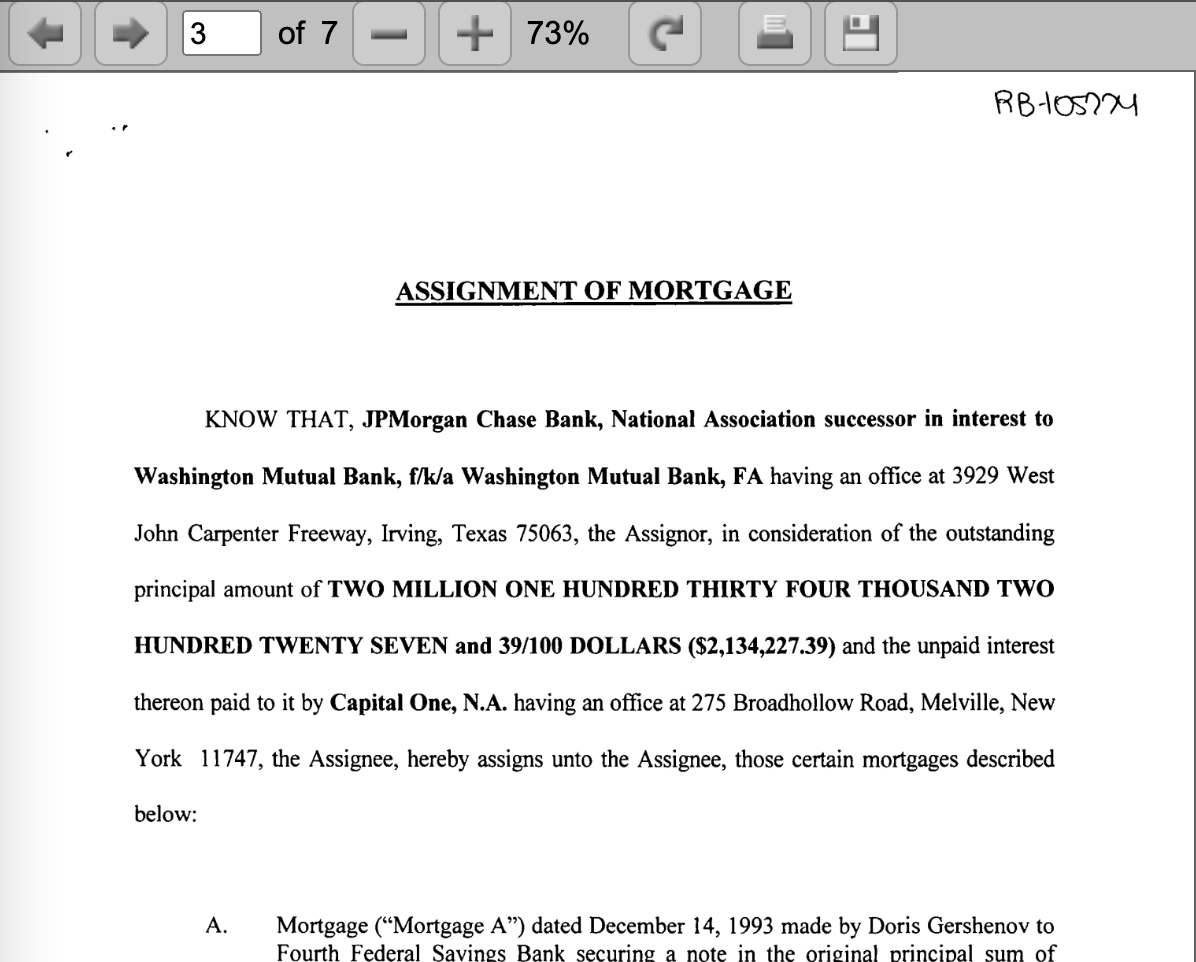
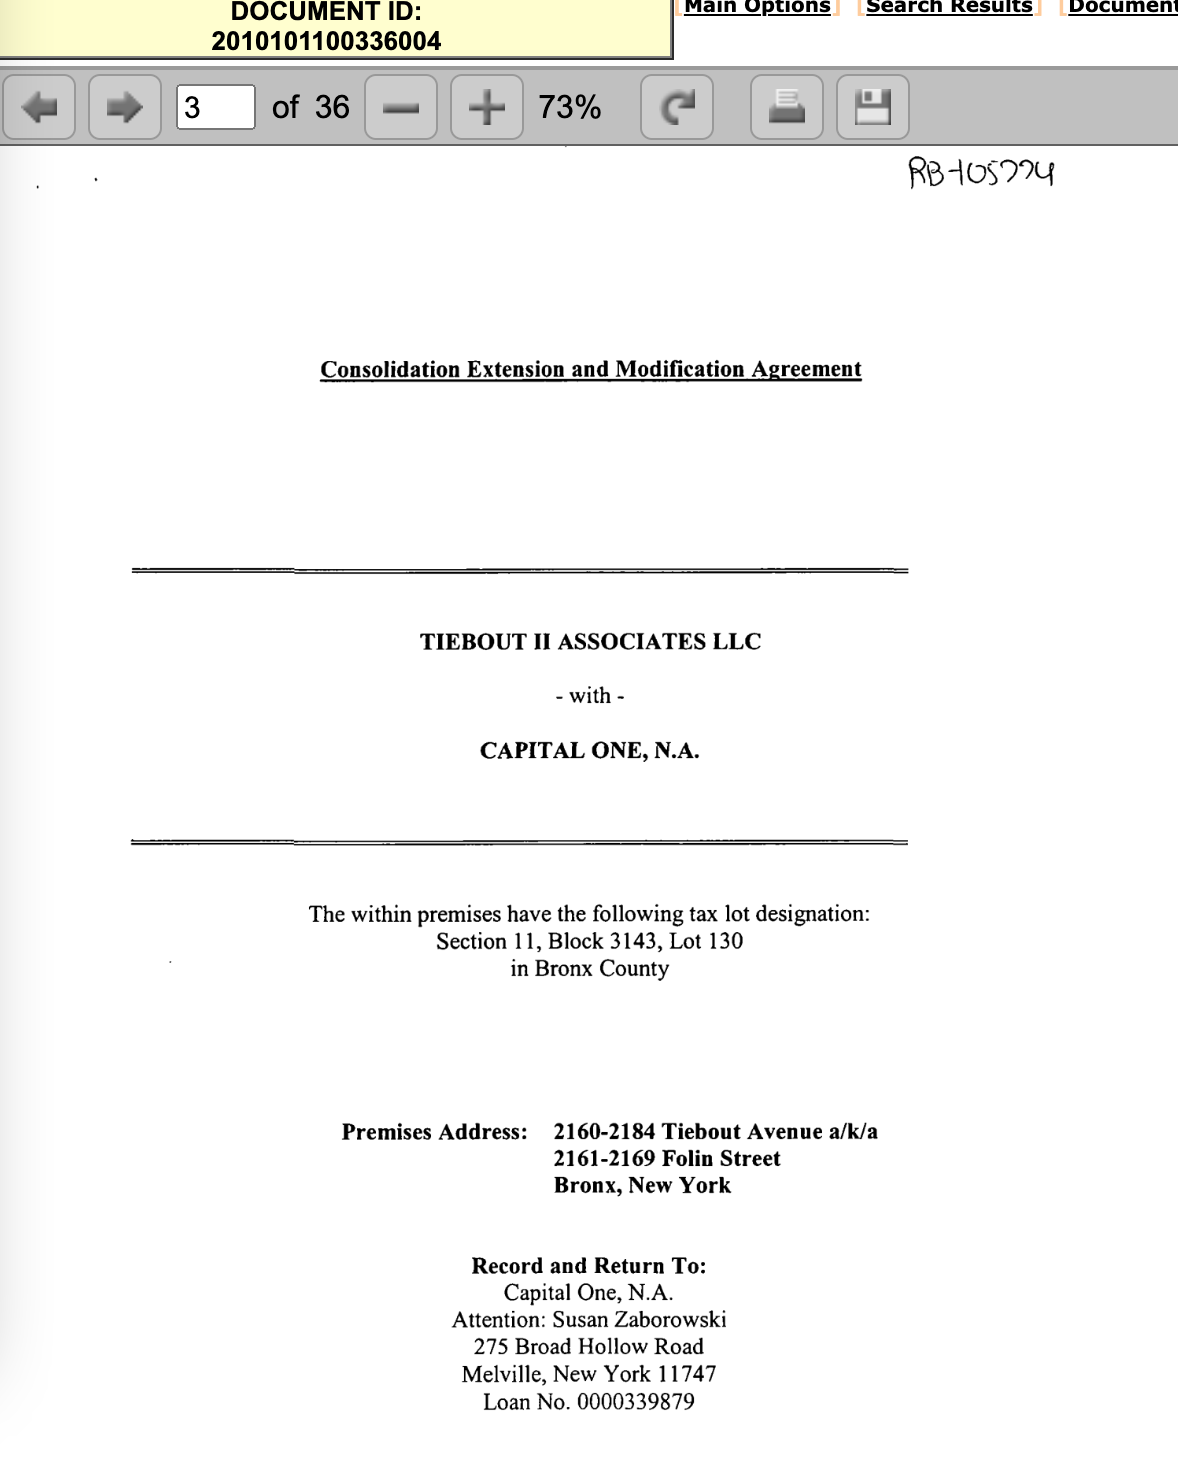
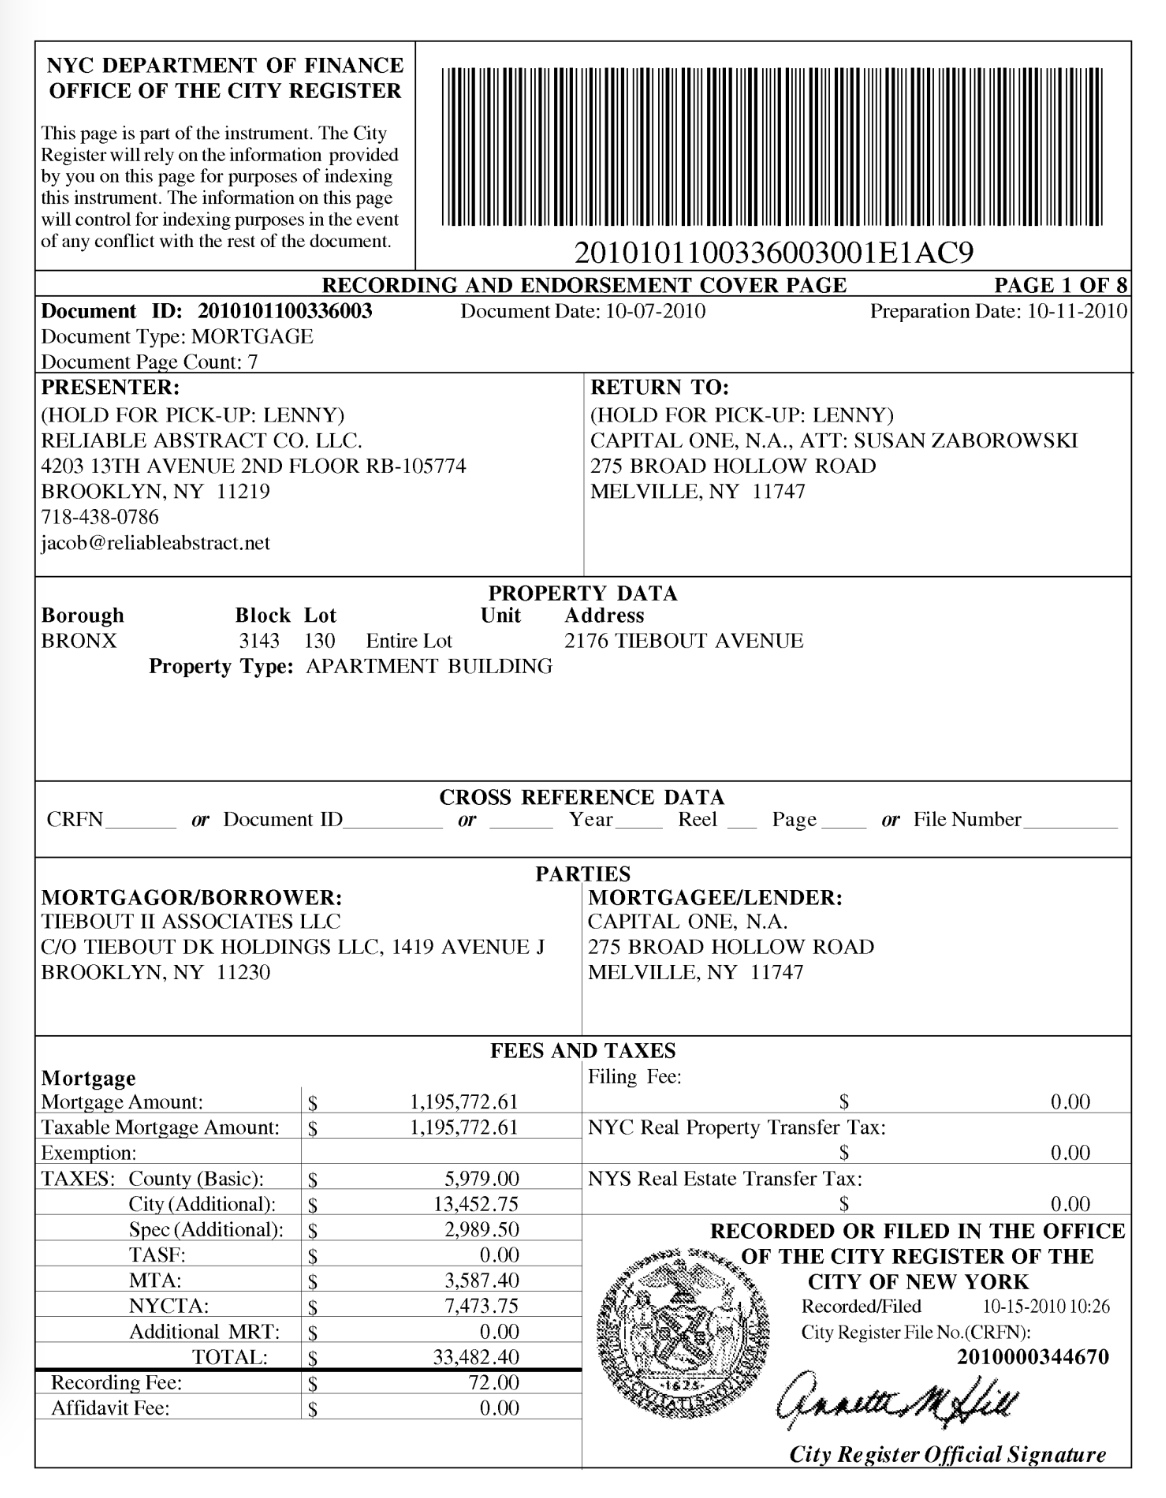
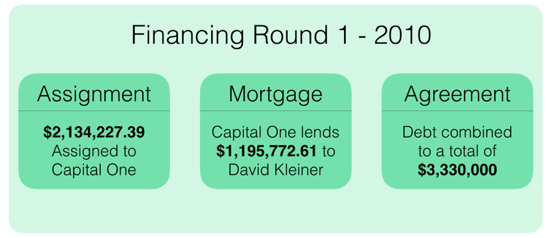
Below is a screenshot of the search results for our example building, 2176 Tiebout Ave. The acquisition financing documents were recorded on the same day as the deed, 10/15/2010. They are the Assignment, Mortgage; the Mortgage, and the Agreement.
First we will look at the assignment from JP Morgan Chase Bank to Capital One. It has a document amount of zero which is typical for assignments. In order to figure out the dollar amount of the mortgage being moved between these two banks, we need to look at the PDF. On the 3rd page of the assignment document the amount is written out – $2,134,227.39. This number represents the outstanding debt from the previous owner. At the time they sold the building they still owed JP Morgan Chase just over $2M. However, the new owner was going to borrow from Capital One, not JP Morgan. Because of this banking change moving forward, the previous owner’s debt had to be moved from one bank to the other so that it could be transferred to the purchaser and rolled up with any additional debt issued by Capital One.
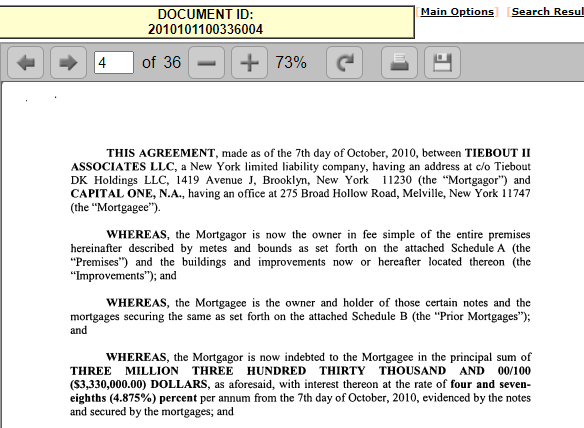
The next document we will look at is the mortgage signed on 10/7/2010 where Tiebout II Associates LLC is borrowing $1,195,773 from Capital One, N.A. This dollar amount is the amount of additional debt that the buyer is choosing to take on. Mortgage documents can sometimes contain a variety of interesting information. We will look at these components later on, but for now we are interested in who the lender is and how much debt they are supplying.
Next, we will look at the agreement signed on 10/7/2010 between Tiebout II Associates LLC and Capital One, N.A for $3,330,000. This number is the sum of the debt moved in the assignment and the additional debt taken out in the Capital One mortgage. Notably, the total amount of debt taken on yields a LTV (debt / deed amount) of 75%.
Total Debt = Seller’s Debt + Buyer’s Debt =$2,134,227.39 + $1,195,772.61 = $3,330,000.00
To acquire 2176 Tiebout, David Kleiner (the new owner) took on the seller’s remaining debt, which totaled approximately $2.1 million. He then added on additional debt, approximately $1.2 million, so that the LTV of the acquisition loan would be exactly 75%. In other words, the new owner wanted to maximize the amount of debt on the property. The $3,330,000 of debt on the building breaks down to $55,500 of debt per unit. Additionally, we learned that Capital One funded the purchase of the building.
The next step in building out a financial history of the current owner is to look at any additional rounds of financing, known as refinancings, that have occurred since they acquired the building. Often owners will refinance their buildings every few years, as it is a way for them to increase their profits. This can happen in a few ways. Sometimes, due to shifts in interest rates, landlords can refinance their buildings to lower the total cost of their mortgage. However, it is more common, especially in NYC, for landlords to choose to refinance in order to capture a building’s rising property value. We will discuss the mechanics of the popular cash out mortgage structure,but first please read the note below for some perspective on how a landlord’s finances work. You can read more on this in our Landlord Financing and Operations guide (LINK).
____________________________________________________________________________
Landlord Financing
Landlords hold the majority of their wealth in the property, or assets, that they own. Property is a powerful financial asset, because our economic system is set up such that property not only rarely loses value, but often increases in value over time. An increase in the value of a property creates equity for the owner. For a landlord, equity is a form of profit; the problem, however, is that it is not liquid, meaning that it is not immediately convertible to cash. In other words, landlords cannot simply use equity to make purchases or pay their employees or investors.
To turn equity into liquid capital, landlords take on additional mortgage debt. This is a way to translate the increased value of the building into cash in an account at the bank. Homeowners can do this too; if you’ve ever heard of a home equity line of credit or a reverse mortgage, these are tools that homeowners use to turn equity into cash.
However, the big difference between landlord and homeowner financing is in the risk-reward calculus of taking on additional debt. Mortgages are always secured by the property against which the mortgage is taken. In other words, the lender only provides the mortgage because it is backed by the value of the property, which the lender will be able to seize via foreclosure if the landlord fails to make the agreed upon payments.
For a homeowner, then, the choice to take on a mortgage is limited by the increased risk they are willing to take of being foreclosed on. Taking on debt means increasing the size of the mortgage payment, and if a homeowner misses those payments, they risk losing their home. For a landlord who sees their property as a business rather than a home, the risk-reward calculus is different. They are more interested in squeezing profit out of the building, even if it means taking on a debt load that may turn out to be unsustainable. Landlords also face significantly less risk than homeowners because many chose to incorporate as limited liability companies. We discuss limited liability in detail in the Landlord Operations and Real Estate Finance Guide (LINK). For now, the important thing to know is that limited liability means that if a landlord-owned building is foreclosed upon, the bank cannot go after the landlord’s other assets and personal wealth. In a foreclosure, the equity that a landlord has pulled out from the building — to use as money to buy other properties or enrich themselves — is not threatened. In reality this makes it so that there is little to no consequence for a landlord who is foreclosed upon, effectively incentivising them to take on large amounts of both debt and risk.
____________________________________________________________________________
As mentioned earlier, there are two types of refinancings. The first is a Rate and Term Refinance. In this type of refinancing, the owner gets a new mortgage in order to take advantage of lower interest rates that are now available, or in order to shorten the length of the mortgage. This type of refinance is often focused on saving money in the long run and is generally less important as a reason to refinance a NYC multifamily building. The type of refinancing more commonly seen is the Cash-Out Refinance. In this type of refinancing, the owner is looking to access the equity they have accumulated overtime in the building.
The chart below shows how this process works. The bar on the left represents the building at the time of acquisition. The owner originally took out a loan worth 75% of the building’s total property value. The remaining 25% of the property value was their equity. Overtime, the value of their property increased as shown by the bar on the right. When the property value increased they gained equity and the LTV dropped. The dark red debt section represents the original mortgage they had on the property; everything above the thick dashed line was equity. To turn that equity into cash, the owner refinanced so that the total debt on the building was once again 75% of the property value. The striped square represents the equity the owner was able to liquidate or gain access to as cash by refinancing.
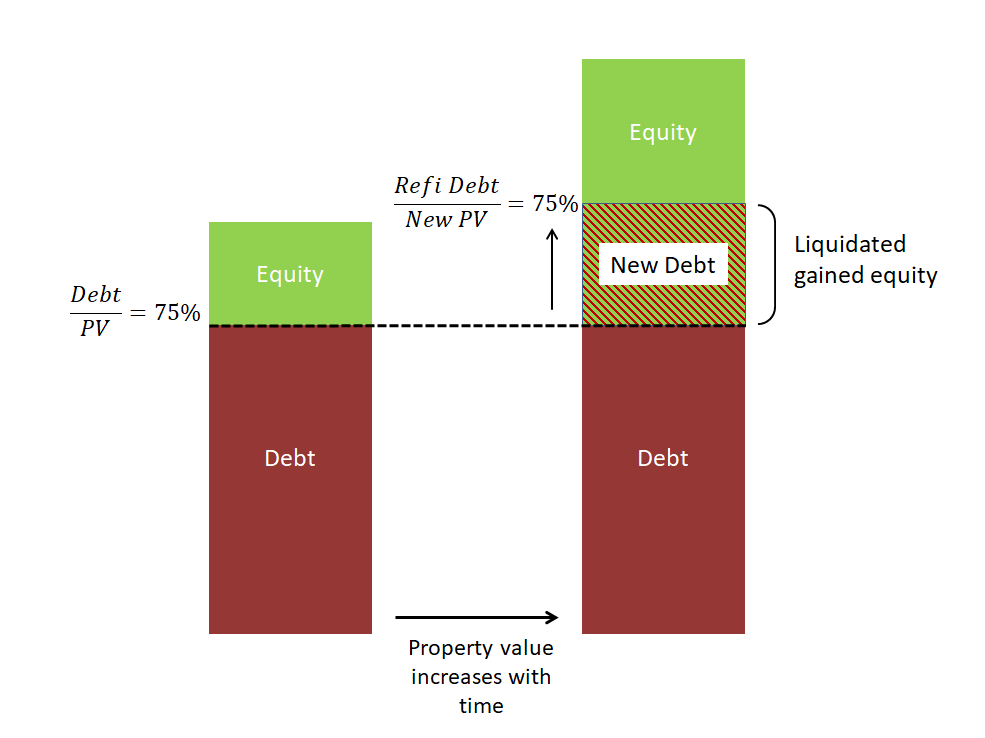
In order to execute this, landlords once again take advantage of the CEMA structure. We saw our first CEMA with the acquisition financing – it allowed the current owner to take over the seller’s debt and maximize the LTV by adding additional debt on top while avoiding a significant amount of mortgage recording tax. CEMAs, as we will see below, work well when a landlord is executing a cash-out refinance. Instead of rolling up the previous owner’s debt with the debt that they themselves have taken out, landlords can roll up their own outstanding debt with new debt when there has been a rise in their building’s property value.
This will become clearer as we move through the refinancings that have happened with our example building on the Refinancing Documents page (LINK).
Refinancing Documents
In this example, there have been 3 rounds of refinancings since the building was acquired in 2010. Each has been a cash-out refinance utilizing the CEMA structure. We will walk through the documents involved in each round below.
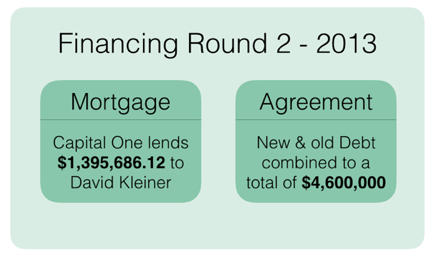
Round 2 – 2013 Refinance
There are two relevant documents here, a mortgage and an agreement. First, we will look at the mortgage which represents the new debt that the landlord is taking on. It was issued on 5/22/2013. TIEBOUT II ASSOCIATES LLC borrowed $1,395,687 from Capital One.
The agreement was issued on the same day between the same parties. The document amount was $4,600,000. This amount represents the rolling up of the landlord’s outstanding debt from the acquisition of the building and the additional $1.39M of debt that they just took on.
From this document amount we are able to work backwards to see how much of the previous debt the landlord paid off. If you recall, at the time of acquisition the landlord had a total of $3,330,000 of debt on the property. In the 3 years since, they paid off $125,686.12.
Remaining Debt from Acquisition = Total Debt – New Debt =$4,600,000.00 – $1,395,686.12 = $3,204,313.88
Through the use of a CEMA, and with the help of Capital One, David Kleiner was able to cash-out $1.4M from the building. This brought the total amount of debt on the building to $4.6M, as he had paid off only $125,686.12, or 3.8% of the debt he took on to acquire the building. This breaks down to $76,666.67 of debt per unit, a 38% increase from the per unit level at the time of acquisition. It is safe to assume that adding this additional debt did not increase the LTV of the property past 75%, this means that Kleiner claimed (and the bank agreed) that the property value had risen to at least $6,133,333 from $4,440,000 in just 3 years – a nearly 40% increase.
Round 3 – 2019 Refinance
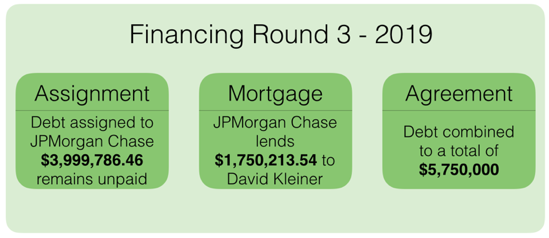
The property was once again refinanced in 2019. This time there were three documents involved because Kleiner used a different bank.
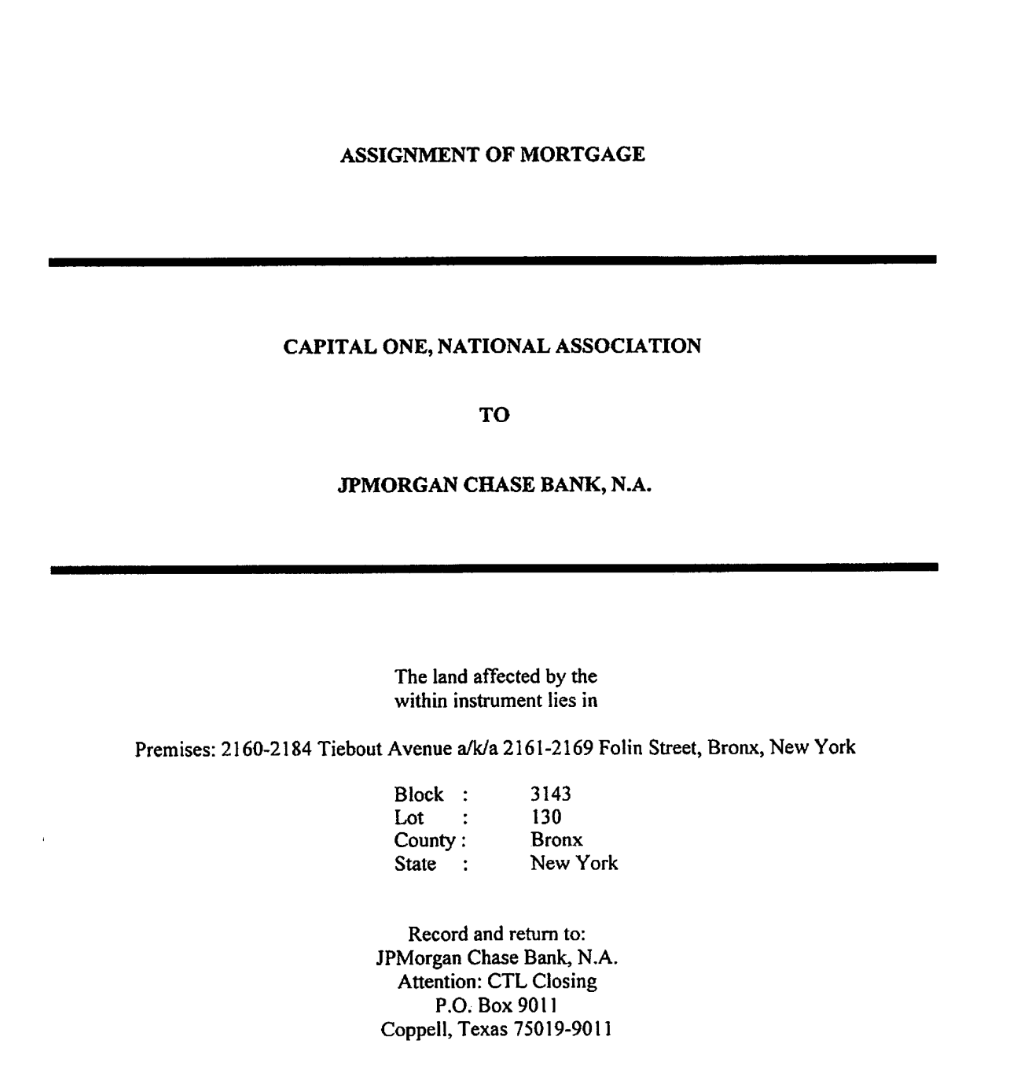
First, let’s look at the Assignment on 6/21/2019. The owner’s debt is being moved from Capital One to JPMorgan Chase as they will be taking on additional debt from JPMorgan Chase.
Next, we will look at the new debt the owner is taking on. The mortgage was signed on 6/21/2019 for $1,750,213.54.
This old and new debt is then combined in the 6/21/2019 Agreement which has a document amount of $5,750,000. Once again, we can use this document amount to work backwards and figure out how much of the debt from the first refinancing Kleiner paid off.
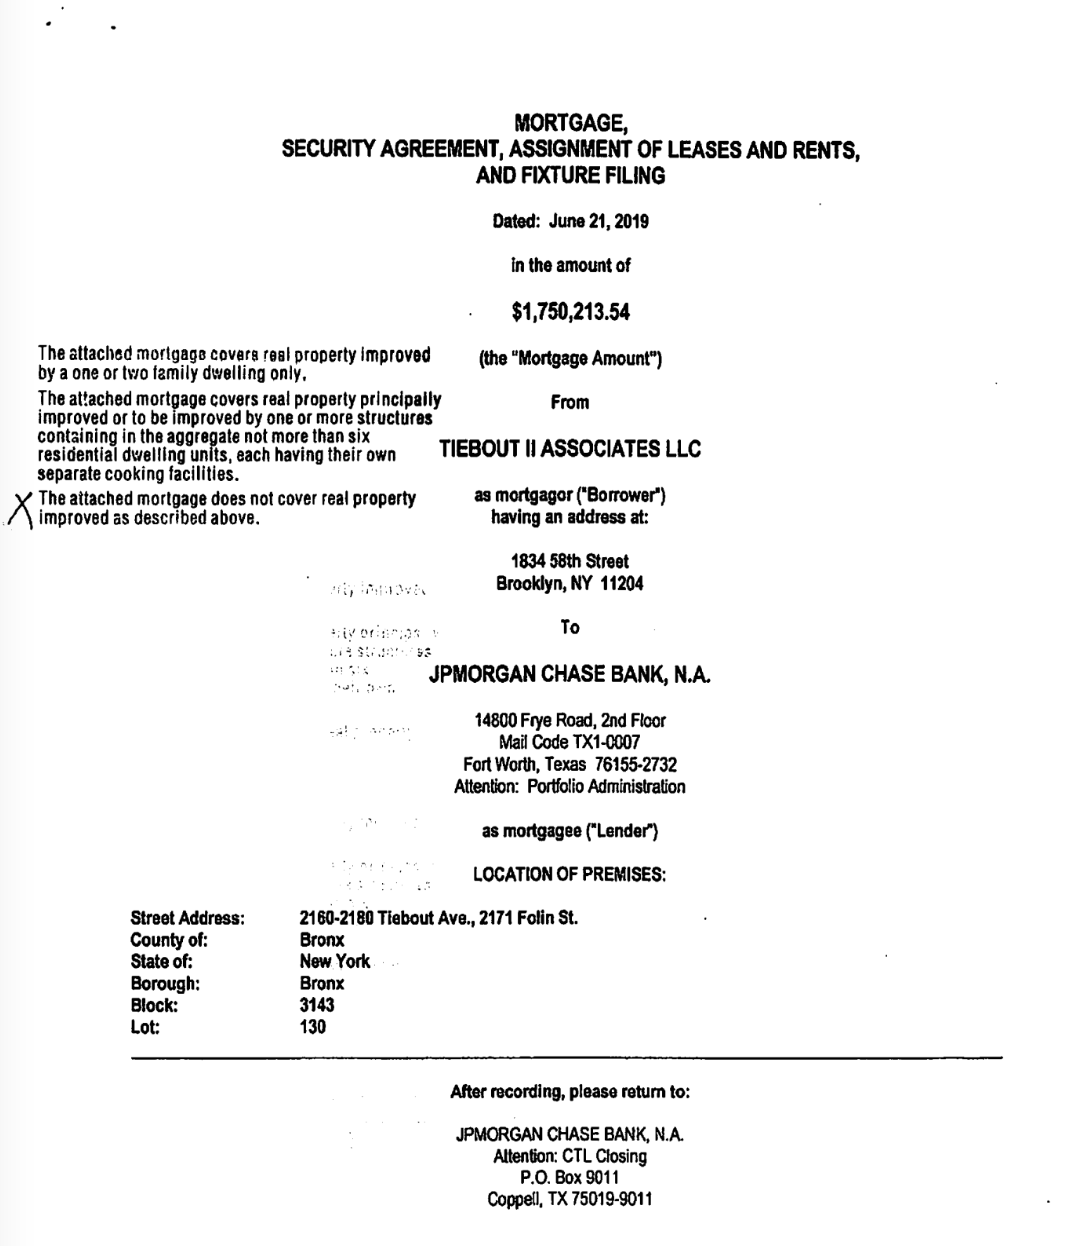
Remaining Debt from 1st Refi = Total Debt – New Debt =$5,750,000 – $1,750,213.54 =$3,999,786.46
Through this refinancing, Kleiner was able to cash-out an additional $1.75M from the building. For this round of refinancing he switched banks, choosing to move his debt to JPMorgan Chase. This brought the total debt on the building to $5.75M as he had only paid 13%, or $600,213.54, of the debt taken on in 2013. This new total debt level translates to $95,833.33 on the per unit level – a roughly 30% increase from the previous round of financing. Assuming a LTV of 75%, this new debt level would be based on a property value of $7,666,667. Recall, he bought the building 9 years ago for only $4.44M.
Round 4 – 2021 Refinance
The owner once again refinanced the property in 2021. This refinancing is a good example of how sometimes weird things happen in ACRIS, but often you can still understand the gist of what is happening. In this case, there is an assignment from the Federal Deposit Insurance Corporation (FDIC) to JPMorgan Chase. This is unusual, as they have not been mentioned on any of the mortgage schedules. Clicking into the pdf shows that they are assigning a mortgage from 2004, years before the current owner acquired the property. It’s somewhat unclear what is happening with this specific document. We will skip ahead to the 2019 mortgage and agreement where we will be able to determine the total debt level on the building regardless.
First, let’s look at the new debt the owner is taking on. The mortgage was signed on 7/30/2021. TIEBOUT II ASSOCIATES LLC is borrowing $250,000 from JPMORGAN CHASE BANK, N.A.
The agreement signed on the same day adds this new debt onto the pre existing debt on the property. The document amount is $6M. Let’s work backwards to find how much debt Kleiner paid off from the previous refinancing.
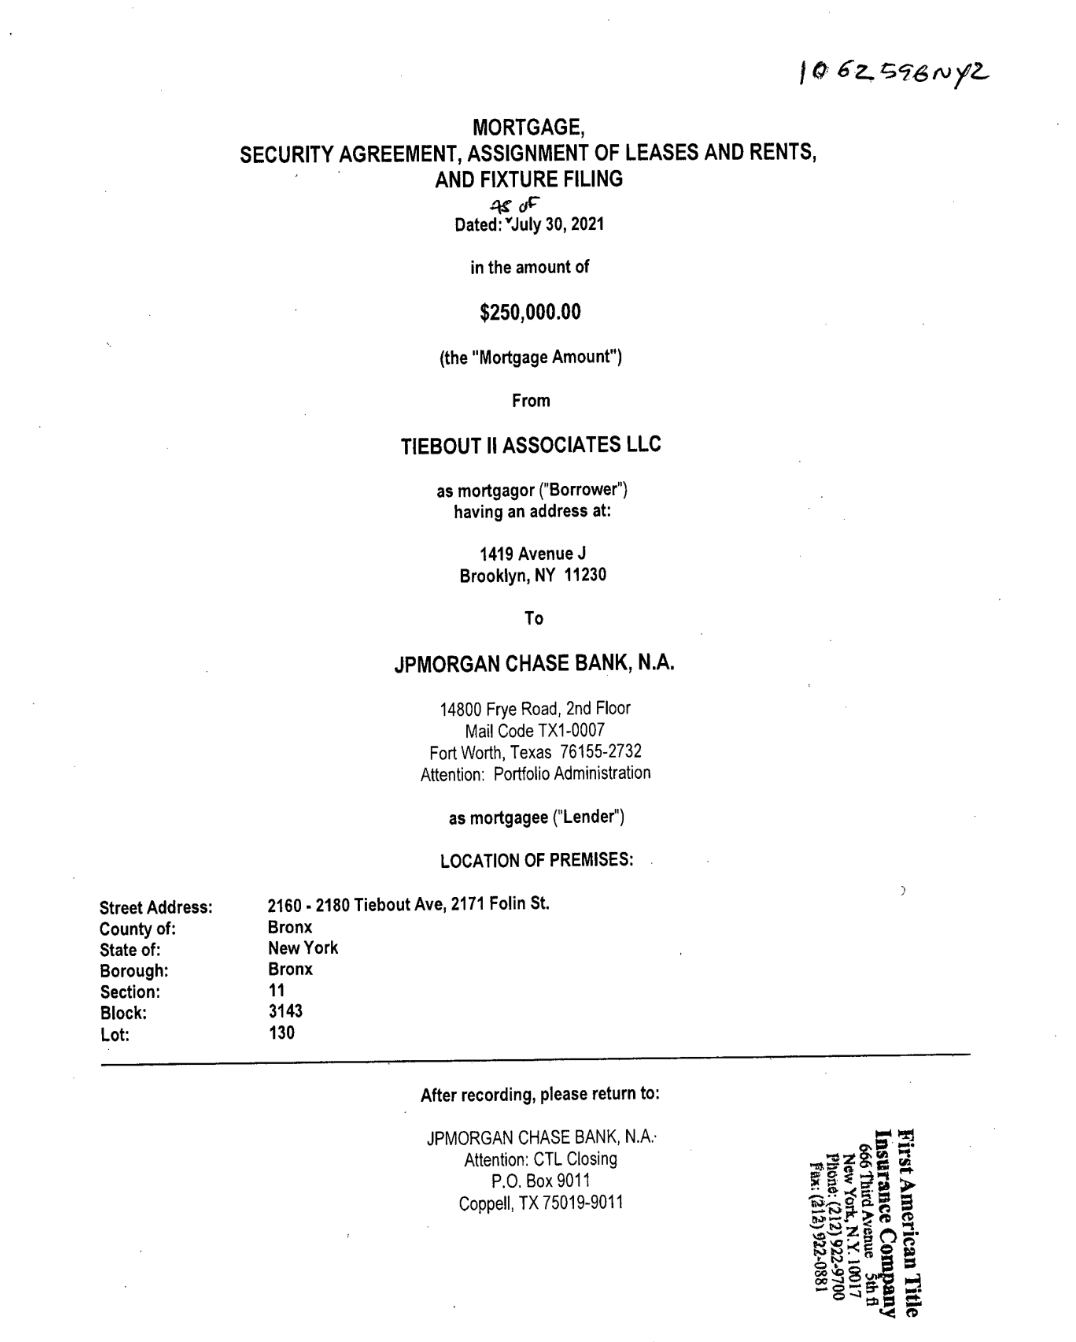
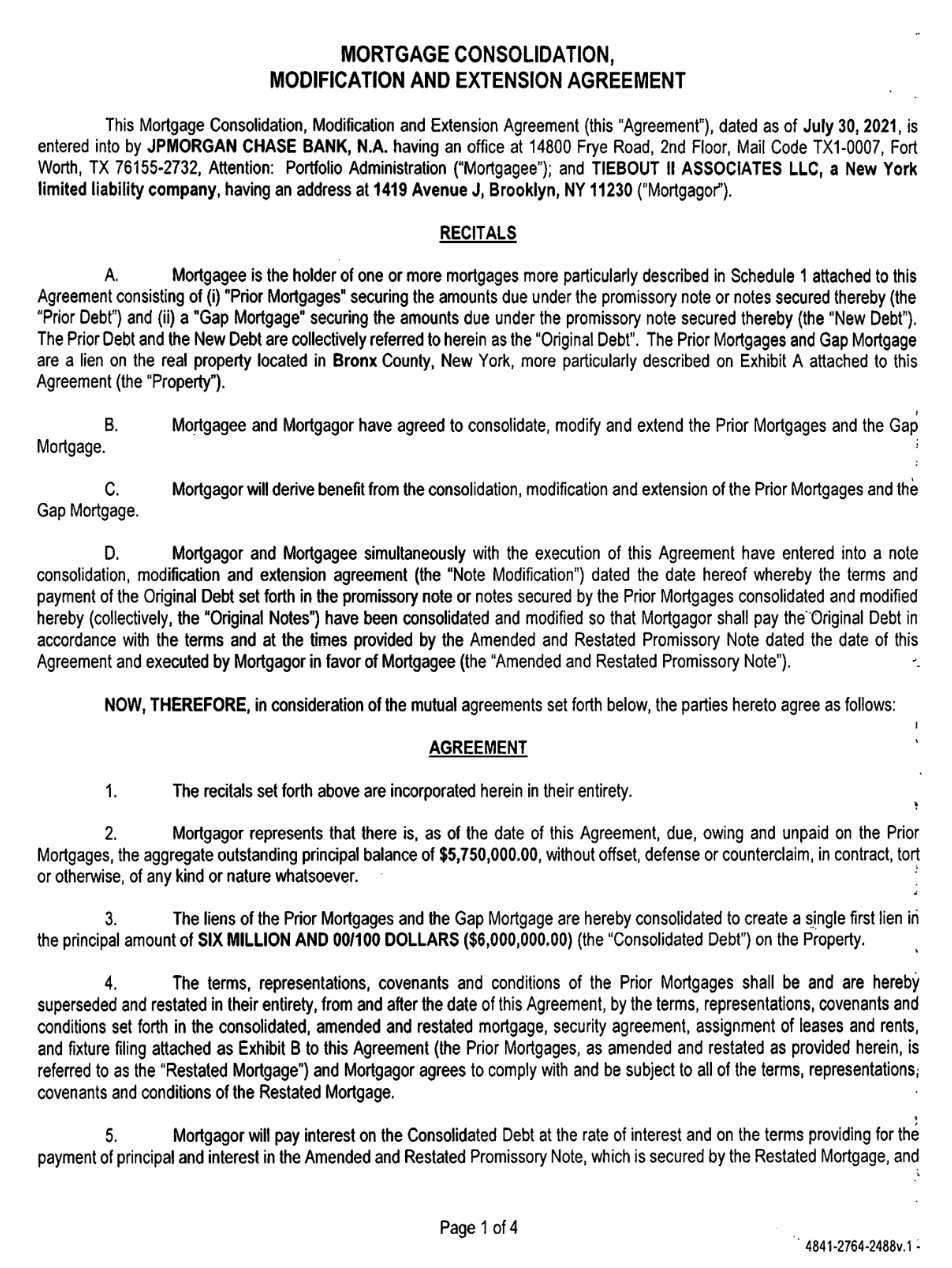
Remaining Debt from 2nd Refi = Total Debt – New Debt =$6,000,000 – $250,000 = $5,750,000
Kleiner once again took on additional debt from JPMorgan Chase after paying down none of his outstanding balance from 2019. This brought the debt per unit to an even $100,000. Assuming a LTV of 75%, this new debt level is predicated on a property value of $8M.
Example Summary
Now that we have collected all of this information, what have we actually learned?
We now know that the current building owner is named David Kleiner. He purchased the building in 2010 for $4,440,000 or $74,000 per unit. Throughout owning the building he has consistently taken out more and more debt from Capital One and JPMorgan Chase – the total debt on the building has never decreased. Below is a table compiling some of the information we were tracking as we moved through the different rounds of financing. First, here is a quick note explaining why we think these calculations are useful and what they can show you.
-
Debt per Unit – Looking at how the debt per unit level has changed in the building over time is very useful. This can be a good way to determine whether or not the owner is pulling equity out of the building. Recall that the more money a landlord puts towards debt service, the less money there is for other expenses like repairs and maintenance.
-
LTV Approximation – As we have said, typically a LTV of 75% is the maximum that a bank will lend. The higher the LTV the closer in value the property and the debt on it. Technically you calculate LTV by dividing the debt by the current property value. We do not have a way to access the property value, we can approximate the LTV using the most recent sale price of the property. This number helps show how much the landlord and the bank have agreed the value of the property has risen. Dramatic and continuous increases could indicate speculation.
|
Round (year) |
Total Debt |
Debt per Unit |
LTV Approximation |
|
1 (2010) |
$3,330,000 |
$55,500 |
75% |
|
2 (2013) |
$4,600,000 |
$76,666.67 |
104% |
|
3 (2019) |
$5,750,000 |
$95,833.33 |
130% |
|
4 (2021) |
$6,000,000 |
$100,000 |
135% |
Currently Kleiner owes JPMorgan Chase $6M dollars. Over the 11 years that we have looked at, Kleiner has only paid down 12%, or $725,899.66 of the principle that he has taken on. Overall, Kleiner has been able to recoup all of the original equity that he put into the building, $4.44M, and pull out an additional $1.56M. On a per year basis that is an income of $141,818.
The 2021 debt level translates to $100,000 of debt per unit, $26,000 more per unit than the building was purchased for. This higher in per unit value is conceptually backed up by a real increase in property value. However, it seems unlikely that this is the case. Chances are slim that Kleiner has done enough work on individual units or the building as a whole – kitchen and bathroom upgrades, boiler replacement, etc – to justify this value increase. In the Bronx, it is also unlikely that he has been able to attract tenants who can pay significantly higher rents.
If neither of these are true, how has Kleiner been able to claim such significant property value increases? This is where the speculative nature of the NYC housing market comes into play – put in a very simplified way, if enough actors in the market agree that buildings’ values are increasing then they can make it true. For example, if a couple of owners are able to sell their buildings at higher per unit prices, others are then able to cite them as precedent/justification for pricing their buildings similarly. New owners are willing to come in at these higher prices because they believe this trend will never stop and that they will be able to even further inflate the price of the building. Lenders buy into this speculation and enable it by not rigorously questioning stated property values, instead they often use the price of similar buildings that are nearby to determine a property’s worth.
The high debt level that the building is carrying is troubling. As we have discussed: the higher the debt, the higher the debt service; the higher the debt service, the less money there is available to cover building expenses and operating costs. Pair this financial analysis with information from tenants and available violation data to better flush out how the landlord’s allocation of the rent roll is affecting them.
What Else Can We Learn?
We can learn more from ACRIS than just what the debt level is. To show what else you can find in these documents, we will consider the mortgage and agreement from the first round of financing.
Ownership
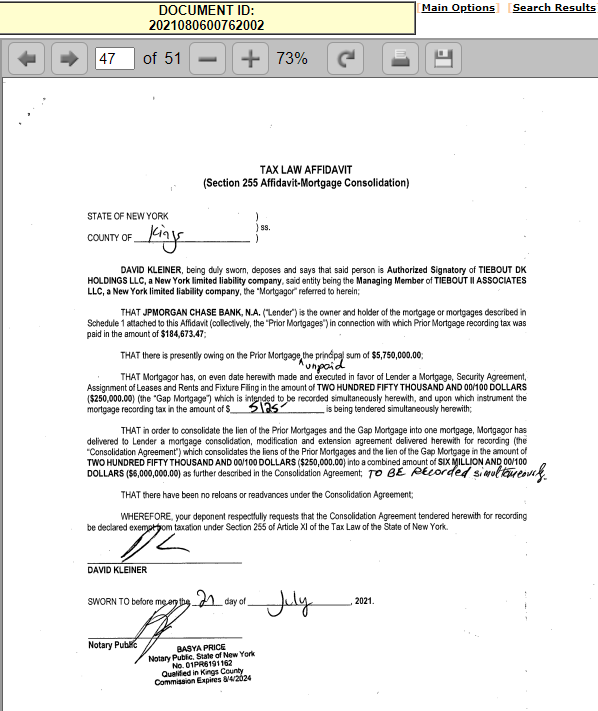
One major piece of information that ACRIS documents can provide is clarity, or at least a good clue as to who the actual owner is. Conceptually, you would be able to determine the owner of a property by looking at the HPD registration information. However, many landlords register their buildings in a way that allows them to keep their name hidden. Owners are normally much less cautious about hiding their name when it comes to financing documents though. Oftentimes their name is printed alongside their signature on mortgages and agreements. In the case of our example property, David Kleiner’s name does not appear in the HPD registration information. Instead, Ignatie Meir is listed as the Head Officer and Managing Agent. However, Kleiner’s name does appear on all of the financing documents. A reliable place to check for the owner’s name is within agreements. When owners are utilizing the CEMA strategy, they must sign and submit a Section 255 Affidavit with the agreement document. This affidavit is related to mortgage tax payments, but importantly it consistently has the name of the signatory typed out. You can find this document towards the end of agreement documents. It comes after the Schedule B section which contains the mortgage schedule. Kleiner has signed all of the agreements throughout the various rounds of financing. Below is a screenshot from round 4, as you can see, the actual signature is not legible, but since the name is typed out it is possible to determine who signed the document.
Below is a screenshot of the deed cover page. All newer documents will have this page. On it you will see a few useful sections. The first is the Property Data section. Here you will find the BBLs that this document covers as well as the property type at the time of purchase.
Sometimes there will be multiple parcels involved with the list continuing onto the next page. In the parties section you will find the information about both parties involved. This will be the same information that you saw in the search results table. However, sometimes there are more than one of each party type involved. This can happen with deeds when there are multiple parties with partial ownership stakes in a property. If there are additional parties, they will be listed on the second page.
You can click through to the end of the deed document to see if there is a legible buyer’s signature. More often than not there isn’t, but it’s always good to double check. Again, you may be able to find an associate’s signature that could help you figure out who owns the property.
Mortgage Terms
Looking beyond simply the mortgage amount can help paint an even fuller picture of a building’s finance. Interest rate and amortization information can allow you to calculate how much the landlord has to pay in debt service every month, looking to see if there is a good repair clause can inform a potential organizing strategy, finding the schedule B – which tracks all of the mortgages on a property – can help you quickly piece together how much debt is on a building and how it was acquired.
-
Interest Rate
In some agreement documents, you are able to see what interest rate the lender is charging. This is useful as it can help you get a better feel for what the true cost of the mortgage is – interest gets added on top of the principal amount borrowed. For our example building, you can find the interest rate for the first round of financing on page 4 of the agreement document.
-
Amortization
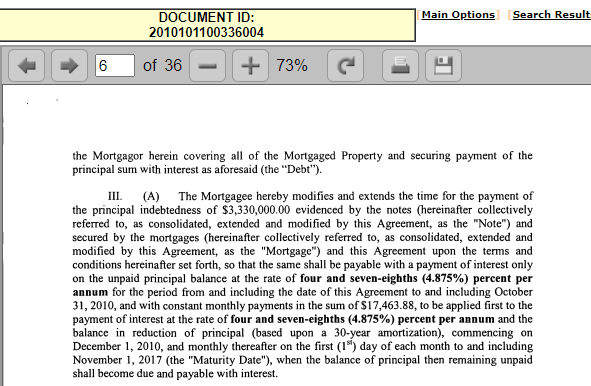
Amortization is how the smaller, monthly payments due over the lifetime of the loan are calculated. In the agreement you can find the actual monthly payment that has been agreed to written out on page 6. When you can find it this is a really interesting piece of information because you are able to see how large of a debt service the landlord has taken on. If you have an idea of what the rent roll is in a building, you can then determine what percentage of the rent is going towards monthly debt payments instead of building repairs and maintenance.
-
Good Repair Clause
This is found in many standard mortgages. This clause simply states that the owner must maintain the property throughout the life of the loan. This clause is included to reduce the risk for the lender as if the building is not maintained, its value, the collateral securing the loan, may decrease. This would make it challenging for the lender to recoup the money they lent through foreclosure if the owner were to default. While this clause is often just a generic clause, it does highlight the ability that lenders have to play a more active role in the buildings they finance. It is in lenders best interests to ensure that landlords are making needed repairs and completing routine maintenance in the buildings that they lend on as their ability to recoup the funds they have lent depend on the building not being in disrepair.
-
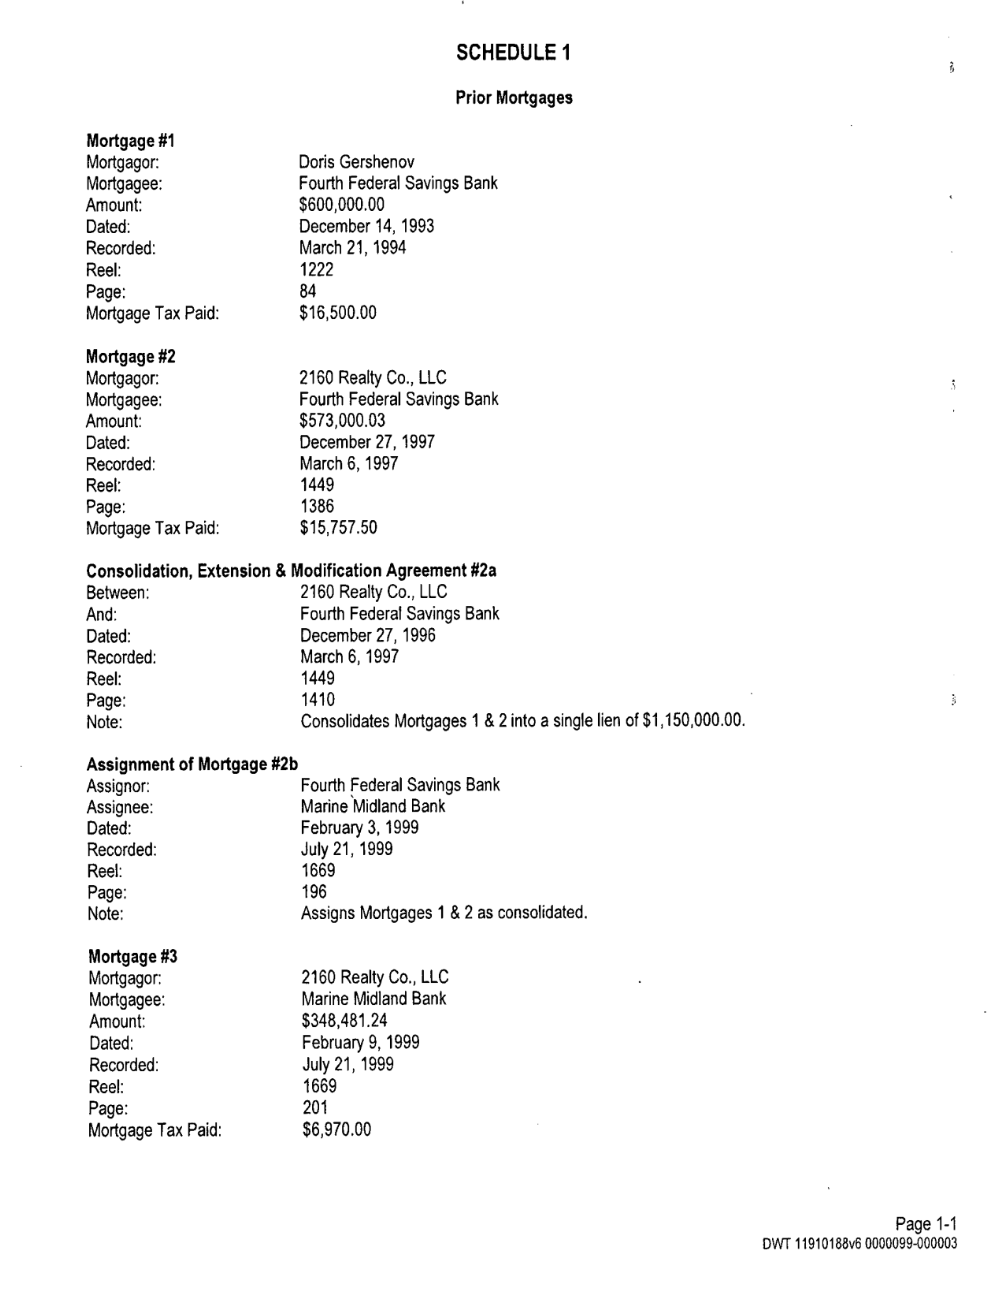
Schedule B
This is where you can find the mortgage schedule in agreements. It is typically towards the end of the document. A mortgage schedule will lay out all of the financing documents relating to a building in order. It is really useful if you are trying to piece together the story of what has happened in a building, as we did with our example property above. Below is a screenshot of the first page of the mortgage schedule from the 2021 agreement from our example building. As you can see, it notes who lent the money, who the borrower was, when it was lent, and how much. It also tracks how much was paid in mortgage recording tax as well as the remaining unpaid principal from previous loans.
How to Use ACRIS
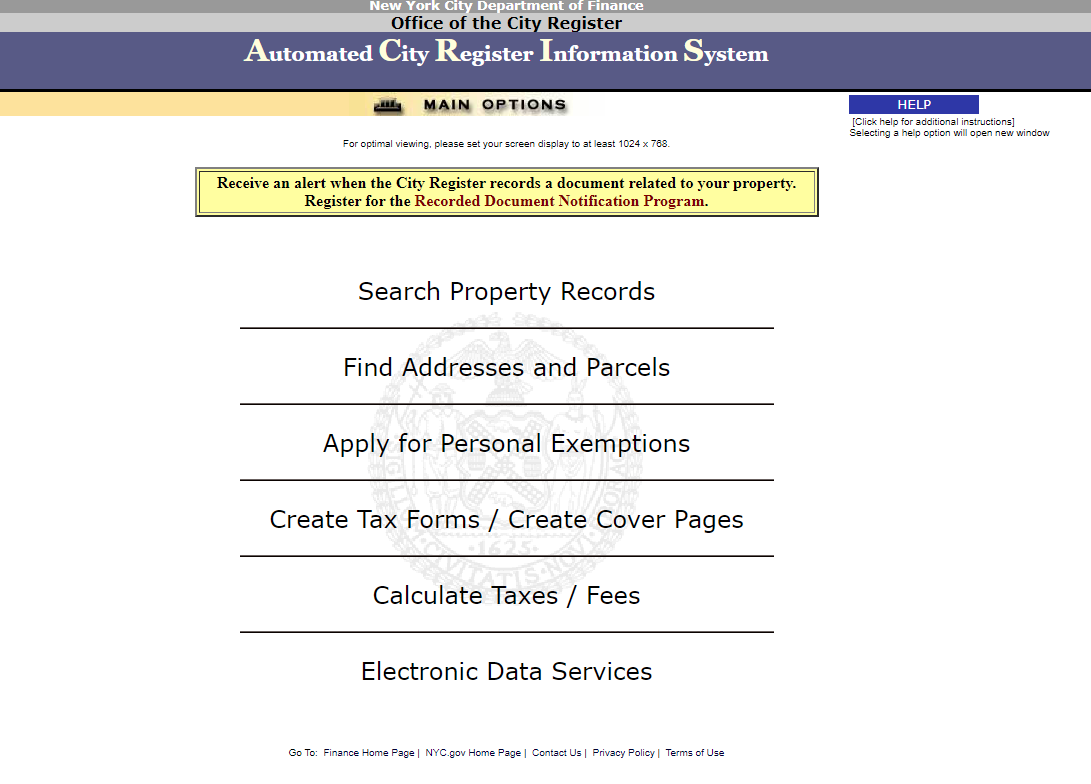
There are a few ways to actually search for information on the website. If you know the BBL of your building, go ahead and click on ‘Search Property Records’. If you have not yet looked up the BBL for the address you are researching, you can do so by clicking on ‘Find Addresses and Parcels’ – enter the address information in the ‘Property Address’ section then click ‘Find BBL’. The BBL will be displayed in its three constituent parts (Borough Block and Lot).
Once you have clicked on ‘Search Property Records’, you will see all of the different search type options available.
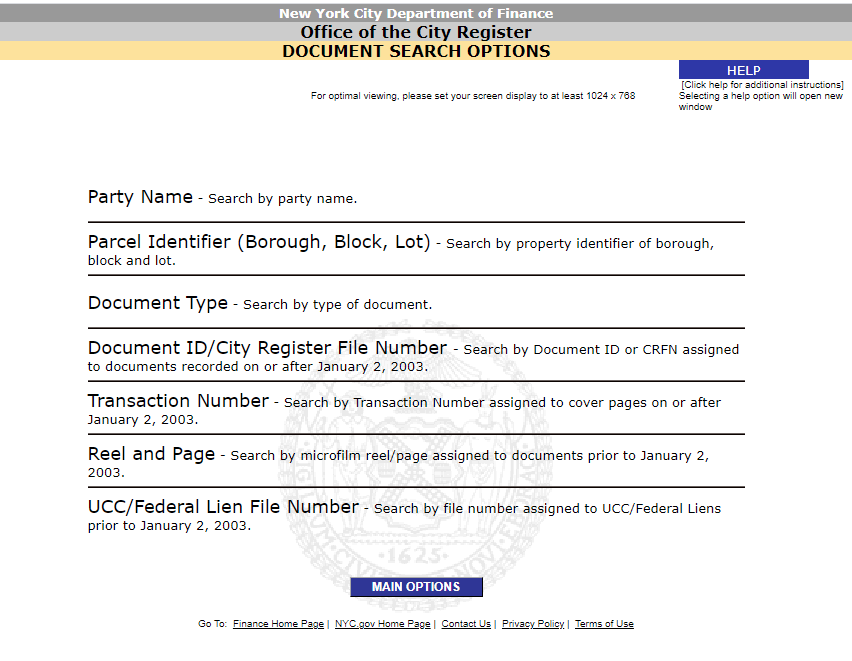
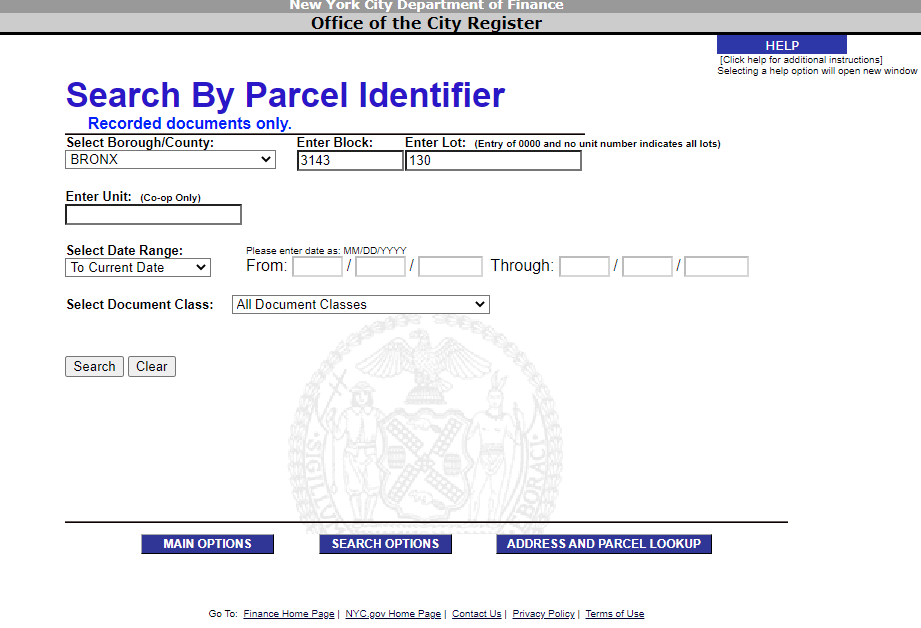
When researching a specific property, we use the ‘Parcel Identifier (Borough, Block, Lot)’ option. Using this method will return all of the documents relating to the BBL that you have searched for. Simply select the borough that the property is in from the drop down and enter the block and lot information. You do not need to use any of the date or document class filters. Then hit the gray ‘Search’ button.
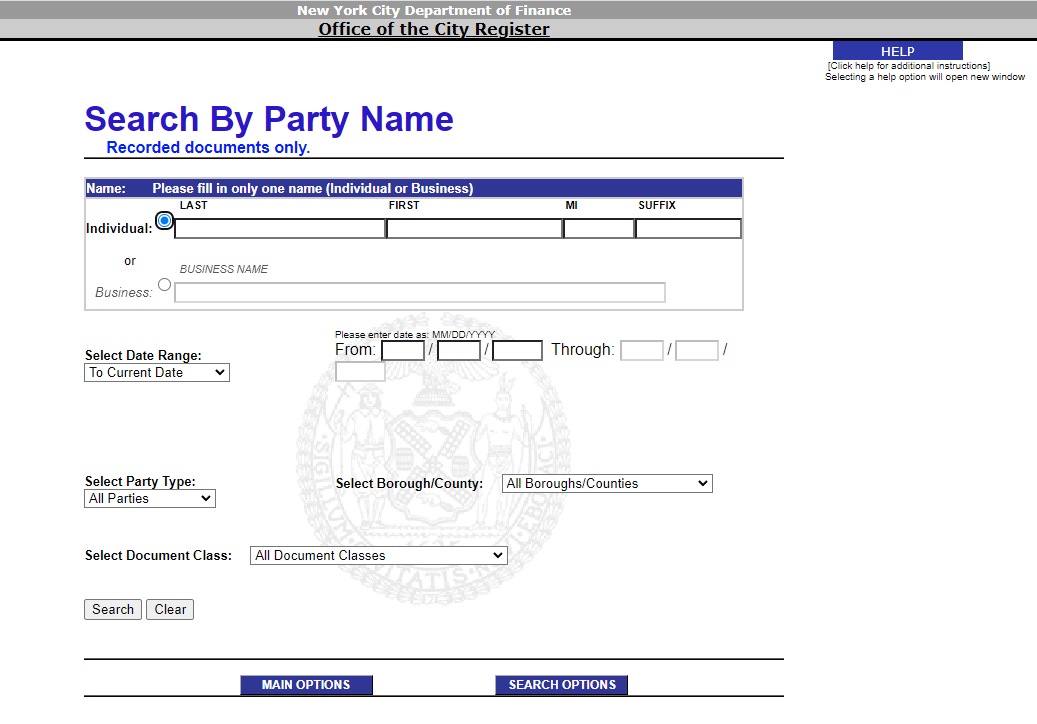
The ‘Party Name’ option allows you to search for documents by who signed them. You can look up individuals using first and last name or you can search by business name. You can restrict your search results further by adding a date range, borough, class of documents, and party type (to see who to expect as party 1 and 2 for different document types the Useful Terms section of this guide. This search method can be useful if you are trying to research a portfolio. However, there is a high degree of error in searches of this type as oftentimes owners will use different LLCs. Additionally, when searching for what is known as a string of text there is always a higher degree of error as people will often use varying abbreviations without thinking or accidentally make a typo when entering data into the system. If you think you have figured out how the landlord you are interested in typically fills out paperwork though, this might be a good option.
Another search option is ‘Document Type’. This function allows you to look at all documents of a certain type – to read more about the document types that we typically pay attention to check the Types of Documents section at the end of this guide; see a full list of the types of documents available in ACRIS here. You can limit your results by date range and borough. While this search option isn’t particularly useful when it comes to researching a building or a landlord, it could be useful if you are interested in tracking lending or sales in a borough.
Additionally, if you want to quickly view a document that you have looked at before and have identifying information about, you can search by ‘Document ID/City Register Number’.
No matter what search method you choose, your results will be returned in a table listing out different documents. By default the table will only show the 10 most recent documents. You can expand the number of documents that you can view at once using the drop down ‘Max Rows’ at the top of the table. Note, you can only display a maximum of 99 rows at a time. When this is the case, click the orange ‘next’ button at the top of the table to view the rest of the documents. Each document, or row, will have a few columns showing you basic information. This can allow you to quickly skim through the documents that are available and start to get a feel for what is happening. You can also edit your search if need be by clicking on the ‘Edit Current Search’ button at the bottom of the table. The search criteria used will be summarized in a light yellow box in the top right corner of the page.
Other Common Patterns You Might See
-
Portfolio Sales & Financing
While not the case for our example building, landlords who own multiple properties will often lump them together. This can happen with title documents (deeds) as well as with financing documents. When these portfolio transactions take place you will see the list of BBLs that the document pertains to on the cover page of the document. The document will appear in the search results for all of the buildings that are listed. If you stumble across documents covering multiple properties you may want to broaden your data collection to the entire portfolio, or at least what you can find of it. Landlords who own multiple buildings often think portfolio wife when it comes to financing. If you are trying to understand the financial standing of the owner, knowing where they stand with their other properties is required – Do they have large amounts of debt on all of their properties? Are all of their buildings in poor physical shape? To learn more about how to approach researching these types of questions, check out the How to Research a Portfolio guide [LINK].
If you do come across a set of portfolio documents, do be sure to take building size into account when calculating debt levels for the individual buildings involved – the document amounts will be the total for all of the buildings on the document. To do this you will need to find the number of residential units in each building. You can then divide the total document amount by the number of total units to get the per unit amount. To determine sale price or debt level for an individual building you can then multiply this per unit number by the number of units in the building in question.
-
Multiple Sales — What happens before the current ownership?
So far we have only focused on what has happened with the building since the current owner took control. However, to get a fuller picture of the property, it is useful to note what the history of the building before the current ownership had been. Look at previous deeds to see who has owned the property – Any notorious landlords in the building’s past? Has the building consistently changed hands every couple of years?
-
Deeds in Common / Partial Ownership Stakes
Another thing you may notice is partial ownership stakes. It is possible for multiple people to own smaller parts of entire buildings through what are called deeds in common. For example, building ownership could be split between two owners 50/50. Ownership stakes can be split an infinite number of ways, but it is good to know everyone who has an ownership stake in the property, even if it is relatively small, as they have influence over how the building is maintained and tenants are treated.
Important documents you might see
-
• Foreclosure docs
-
• Regulatory Agreements
-
• Liens
-
• UCCs
Useful Terms
ACRIS Fields
-
Doc Date: This is the date that the document was signed.
-
Recorded / Filed: This is the date that the document was logged into the ACRIS database. It is typically later than the Doc Date as it takes time for the information to be added to the system.
-
Document Type: This column will tell you what type of document you are looking at. You can view the full list of document types here.
-
Party1, Party2, Party3 / Other: The meaning of these columns changes based on the type of document that you are looking at. We will state what Party1 and Party2 represent for the document types we highlight below – Party3 / Other is often blank.
-
Doc Amount: This tells you the dollar amount associated with the document. Importantly, documents can be associated with multiple parcels. It is important to verify whether or not this is the case before using the document amount in your analysis.
Types of Documents
- Deed (DEED & DEEDO)
-
The deed lets you know who holds the property ownership and how much they paid for the building. Note that deeds from before 2003 may not have a document amount as ACRIS was not available online.
-
Party1:This is the individual or entity who is selling the property.
-
Party2: This is the individual or entity who is purchasing the property.
-
Sometimes the listed document amount is for more than one building. To check if this is the case, see if there are multiple BBLs listed on the cover page of the PDF.
-
- Mortgage (MTG, MMTG, M&CON)
-
Mortgage documents tell you how much debt the owner is taking out on the property and who they are borrowing from.
-
Party1: This is the mortgagee – the person taking out the loan.
-
Party2: This is the mortgagor – the lender.
-
Owners can take out mortgages for multiple reasons beyond simply financing the purchase of the building. For example, there are shorter term construction loans. Increasing the debt on a building can also allow for the owner to pull equity out of a building and capture rising property values.
-
The lender is interesting as different types of lenders have different requirements, expectations, and motives – are they a large bank or a non-bank entity like a capital group.
-
- Agreement (AGMT)
-
The agreement document type actually includes more than one type of document. However, the most common agreement relates to the overall debt level on a building, or the total outstanding principal from all remaining mortgage debt. In these documents you will often see owners combining previous and new debt into a single lien. With portfolio owners, this rolled up debt often comes from more than one of their buildings. This type of agreement is known as a Consolidation, Extension and Modification Agreement (CEMA) which we will discuss more in the common financing patterns section. Typically agreements with non zero document amounts that occur on the same day as a mortgage are CEMAs.
-
Party1: The owner/person consolidating their debt.
-
Party2: The lender.
-
- Assignment of Leases and Rents (AALR & AL&R)
-
These documents are associated with mortgages. They establish that the lender is entitled to the building income if the owner defaults on the terms of the loan. The document amount is typically equal to the amount of the associated mortgage or agreement. Sometimes there will not be a separate assignment of leases and rents document as it will be contained within the actual mortgage.
-
Party1: The building owner.
-
Party2: The lender.
-
- Assignment (ASST)
-
Lenders are able to sell mortgages to one another. When this happens there will be an assignment to track the transaction. If you are interested in who holds the debt on a building, it is important to pay attention to assignments.
-
Party1: The original lender.
-
Party2: The lender the debt is being transferred to
-